The $9 Coffee Dossier: Brian Niccol’s Pay vs. The Cost of a Cup
Executive Summary
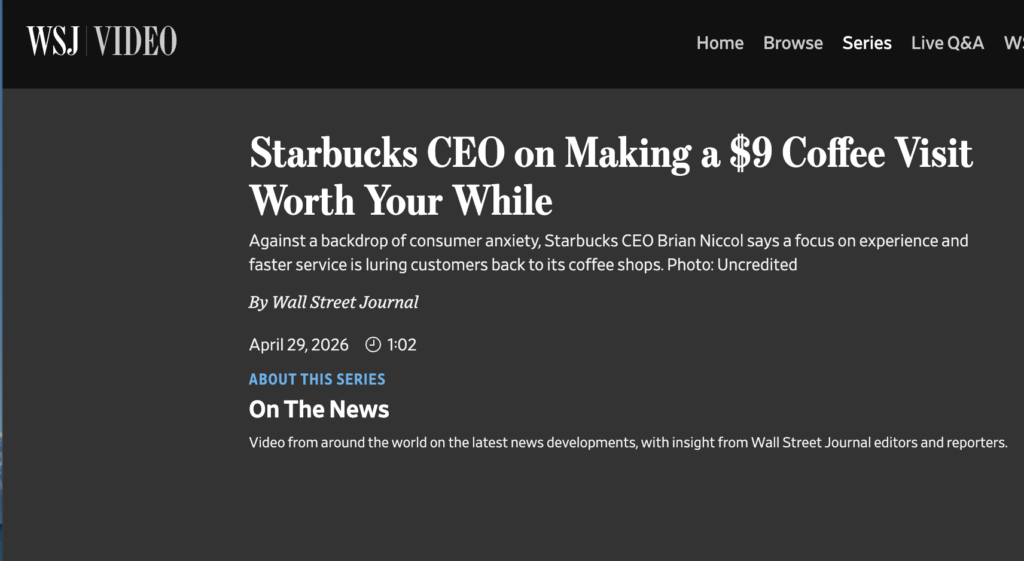
Starbucks CEO Brian Niccol earned $31 million in fiscal year 2025, his first full year on the job, and $96 million in fiscal year 2024, a recruitment-year package dominated by stock awards used to lure him away from Chipotle. At the same time, Starbucks is selling drinks for up to $9 apiece while the physical inputs in that cup cost roughly $1 or less. This dossier strips away the “experience” framing and answers one question with documented numbers: how many $9 coffees does Starbucks have to sell just to fund one man’s paycheck?
Section 1: What’s Actually in a $9 Coffee
The Physical Cost of the Cup
When you strip away marketing language, a Starbucks specialty drink is a commodity product sold at a luxury price. Industry-level and barista-sourced breakdowns of direct input costs are consistent:
- Coffee beans (bulk industrial purchase): a few cents per cup
- Syrups, milk, or alt-milk, ice: a few additional cents to perhaps 25–40 cents for a heavily customized drink
- Paper cup, lid, sleeve, straw: approximately 5–8 cents
A generous all-in estimate for direct materials in a specialty drink at Starbucks pricing is approximately $1.00, and that is deliberately on the high side to account for alt-milk and multiple syrup pumps. A basic brewed coffee is far cheaper; the “paper cup and some warm water” argument holds for those items specifically.
The Markup
At a $9 selling price against roughly $1 in materials, the markup on direct inputs is approximately 800%. That remaining $8 pays for:
- Barista labor and benefits
- Rent and real estate (leased locations, almost universally)
- Equipment, energy, maintenance
- Corporate overhead: technology, marketing, headquarters staff, executive compensation
- Taxes, interest payments, and shareholder returns
The “Experience” Is Not the Point
Brian Niccol has publicly framed the $9 price point as paying for an “experience”, personalization, atmosphere, being your “third place”. However, the overwhelming majority of Starbucks transactions today happen through the drive-through or mobile pickup, meaning customers are not sitting in a welcoming café environment, they are waiting in a car lane or standing in a queue. The “experience” framing is a marketing rationale for a pricing decision, not a description of the average customer interaction.
Section 2: Brian Niccol’s Compensation: By the Numbers
What He Actually Earns
His base salary of $1.6 million represents only about 5% of his total FY2025 compensation. The bulk is stock awards (partially performance-linked, partially time-vested over three years). The FY2024 figure was so large because it was essentially a signing bonus designed to compensate Niccol for equity he was forfeiting by leaving Chipotle.
What He Earns Per Day
- FY2025 ($31M year): approximately $84,932 per day
- FY2024 ($96M year): approximately $263,014 per day
For reference, the U.S. federal minimum wage in 2025 was $7.25/hour, meaning a full-time minimum wage worker earns roughly $15,080 per year, Niccol earns that in approximately 4.3 hours at his FY2025 rate.
Section 3: How Many $9 Coffees Fund His Paycheck?
The Model (Assumptions Stated Clearly)
This calculation uses a simple but grounded set of assumptions. None of these figures are fabricated; they are derived from industry coffee margin data and Starbucks’ own financial disclosures.
| Assumption | Value | Source |
|---|---|---|
| Drink price | $9.00 | |
| Direct materials per drink | ~$1.00 | |
| Gross profit per drink | ~$8.00 | derived |
| Estimated net profit after labor, rent, overhead | ~$2.00 | |
| Portion flowing to owners + executives (50%) | $1.00 per drink | illustrative |
At $1.00 per drink in “upward flow” to shareholders and executive compensation:
Cups required=Profit per cup flowing upwardCEO Compensation
The Results
| Pay Year | Total Compensation | Cups Required (All 40,990 Stores) | Per Store Per Day (All Stores) | Per Store Per Day (Company-Operated Only: 21,514) |
|---|---|---|---|---|
| FY2025 (normal year) | $31 million | 31 million cups | 2.07 cups/store/day | 3.95 cups/store/day |
| FY2024 (recruitment year) | $96 million | 96 million cups | 6.42 cups/store/day | 12.23 cups/store/day |
These figures cover only Brian Niccol’s individual compensation, no other C-suite, no board members, no senior VP pay is included.
What “Company-Operated Stores” Means
Starbucks operates 21,514 company-operated stores and an additional 19,476 licensed stores as of the end of FY2025. The company-operated stores account for 83% of total net revenues. Because licensed stores pay royalties rather than contributing full revenue, it is more meaningful to apportion CEO compensation burden against company-operated stores, the ones Starbucks directly controls and profits from.
On that basis, for every single company-operated store, approximately 4 of the $9 drinks sold each day go purely toward Brian Niccol’s annual compensation under the FY2025 model. In the recruitment year, that rises to roughly 12 drinks per store per day.
Section 4: Contextualizing the Numbers
The Full Revenue Picture
Starbucks reported $37.18 billion in total revenue for FY2025. Company-operated store revenue at 83% of that total implies roughly $30.9 billion from those 21,514 locations, approximately $3,930 per company-operated store per day in revenue. At a $9 average drink price, that implies somewhere on the order of 400–450 transactions per store per day in revenue terms alone (not all transactions are drinks; food and merch are included).
Real-world barista accounts on community forums suggest busy stores can serve anywhere from 400 to 850 customers per day, with high-volume drive-through locations reaching and occasionally exceeding that range. Against that volume, Niccol’s 4 cups per store per day is arithmetically tiny, but multiplied across tens of thousands of stores and hundreds of millions of transactions, the math becomes enormous.
The Product Mix Factor
You are paying $9 not just for coffee but for a product mix deliberately engineered to command premium prices on cheap inputs. Cold drinks, iced lattes, frappuccino-style beverages, heavily customized orders, specialty teas, all of these use:
- Water, ice, flavored syrups (cost: pennies per pump)
- Dairy or non-dairy milk (cost: a few cents to a quarter per drink)
- A paper cup
The markup on those items is, if anything, higher than on plain brewed coffee. Starbucks’ gross margin company-wide sits around 20–28%, but individual drink margins, particularly cold specialty drinks, are structurally higher because the perceived value of customization far exceeds its ingredient cost.
The “Back to Starbucks” Paradox
Niccol’s stated turnaround strategy, called “Back to Starbucks”, focuses on improving in-store experience, simplifying the menu, softening store environments, and “reestablishing the brand’s fundamental identity”. His plan delivered 4% same-store sales growth in Q1 FY2026, including a 3% increase in transactions, the first such positive reading in 18 months. So the turnaround may be working by conventional business metrics.
The paradox: the strategy to revive Starbucks does not involve lowering the $9 price. It involves convincing customers that $9 is worth paying by improving atmosphere, personalization, and speed, in stores where, again, most customers are in a drive-through or mobile pickup queue. The “experience” is largely an aspirational brand narrative rather than an operational reality for the median Starbucks transaction.
Section 5: The Raw Numbers in Plain English
To close with absolute clarity:
- A $9 Starbucks drink contains approximately $1 worth of physical ingredients and packaging.
- The remaining $8 is overhead, margin, and markup.
- Brian Niccol earned $31 million in FY2025, his salary alone was $1.6 million, but total comp was nearly 20 times that when stock and bonuses are included.
- To fund that $31 million package, Starbucks needed the equivalent of ~31 million $9 coffees to generate $1 of upward-flowing profit each.
- Spread across 21,514 company-operated stores over 365 days, that is roughly 4 drinks per store per day dedicated entirely to one executive’s annual compensation.
- In his FY2024 recruitment year, it was 12 drinks per store per day, for a four-month partial tenure.
- None of this includes the CFO, COO, Chief Brand Officer, board of directors, or any other senior compensated role.
The $9 coffee is not outrageous because of what it contains. It is outrageous because of what that price point, multiplied by hundreds of millions of transactions, enables at the top of the compensation structure, while the baristas making those drinks earn wages that Niccol surpasses in hours, not years.
Additional research by Perplexity